The development of an internal dashboard for finance teams can be a lengthy and complicated process, but it is a necessary one if teams are looking to reduce duplicate efforts in separate finance applications.
In order to create an effective and efficient dashboard, we first had to understand the data that they are working with and how it can be best presented. This process usually begins with a data analysis, which helps to identify trends and patterns within the data set. Once the data has been analyzed, we can then begin to develop visualizations for the dashboard.
.png)
These visualizations can take many different forms, but they should all be designed to help users quickly and easily understand the data. The final step in the process is to test the dashboard to ensure that it is functioning properly and that users are able to understand and use it effectively.
.png)
iDesign, which offers a collaborative and customized approach to developing online courses and degrees, had numerous applications in use by different teams across the organization. These teams were duplicating efforts in their respective applications, which created inefficiencies and data discrepancies.
.png)
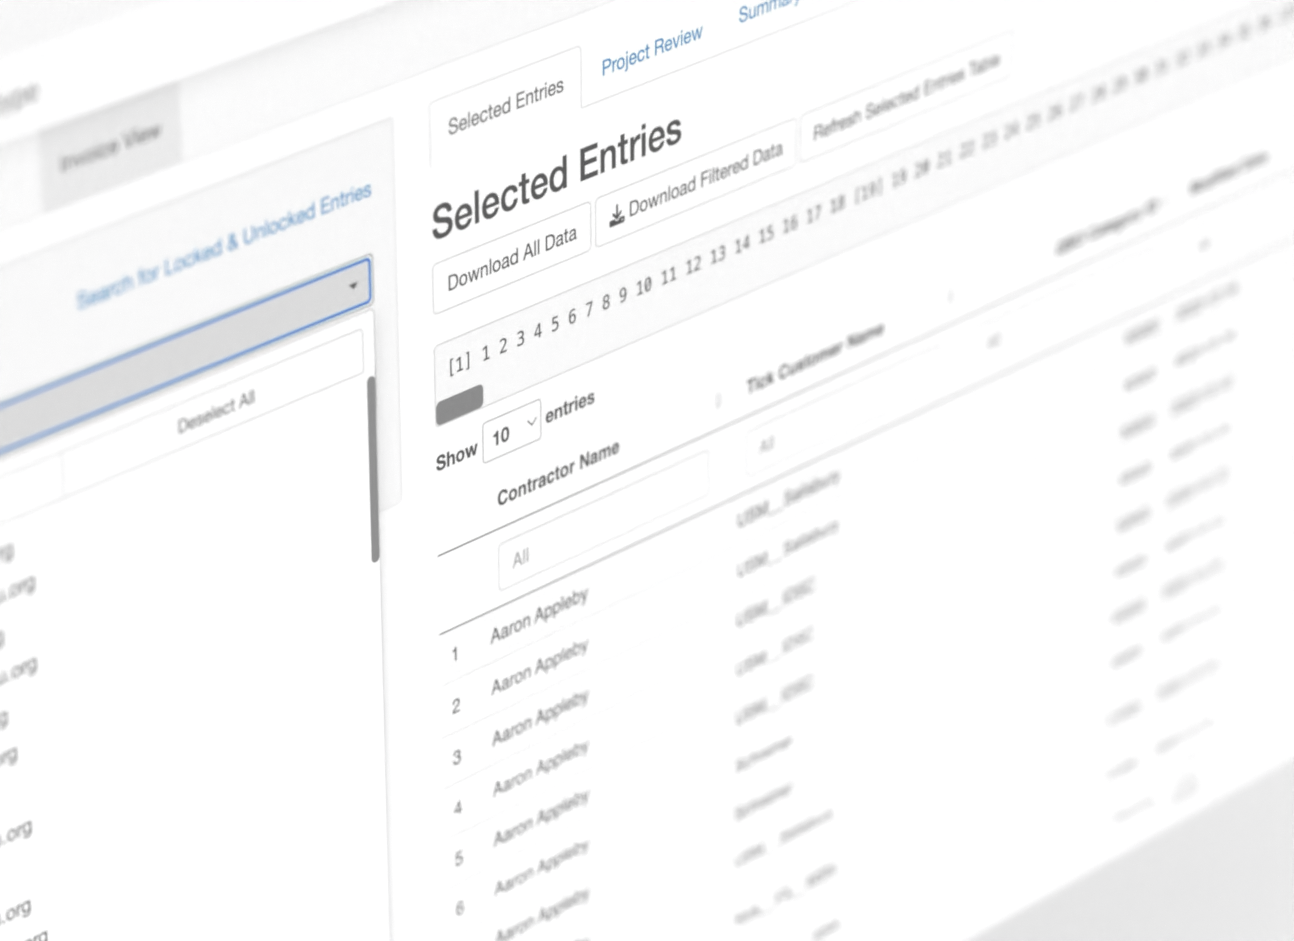
The iDesign team approached us to develop an internal dashboard that would allow finance teams to view data from the applications in one place. This would reduce duplicate efforts and improve data accuracy. We worked as a contractor on the Data Team to understand their requirements and developed a prototype of the dashboard.
.png)
We then worked with them to test the prototype and make sure it met their needs.
.png)
Once the dashboard was developed, we trained the client's finance teams on how to use it. We also provided support to the teams during the rollout of the dashboard.